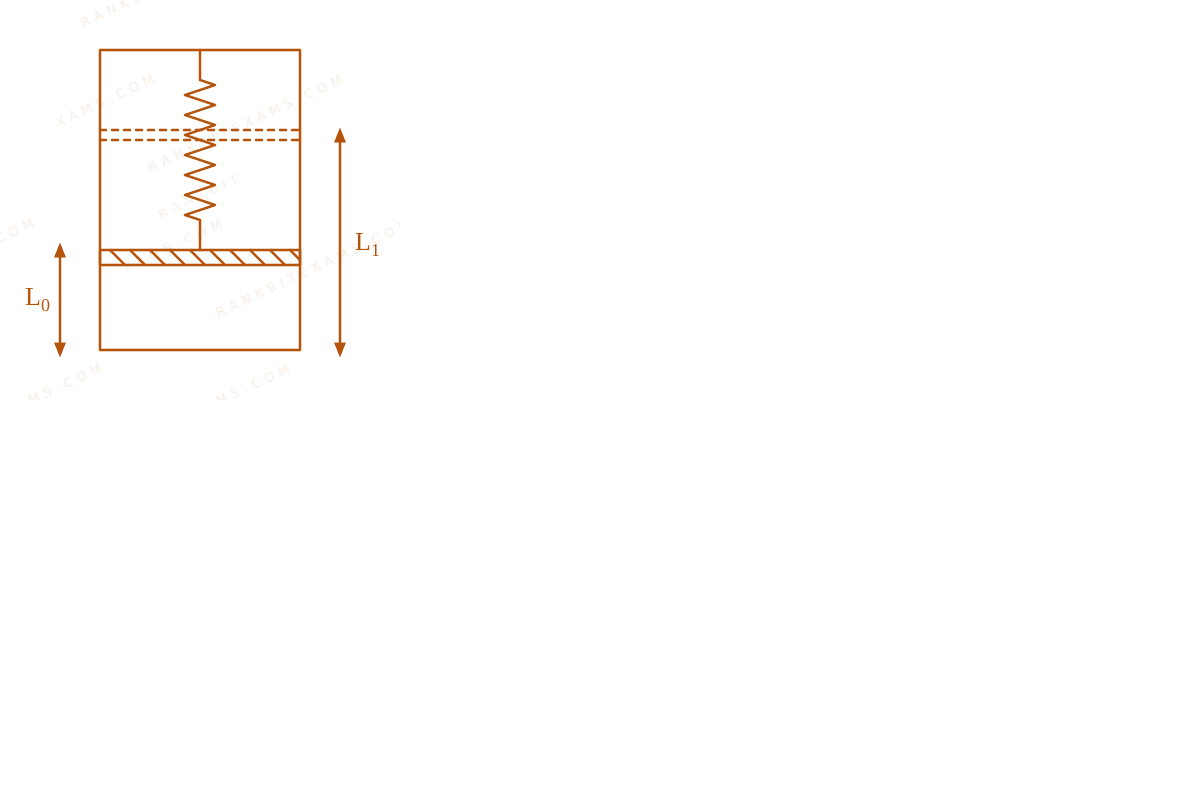
0.08text kg$0.08\text{ kg}$ of air is heated at constant volume through 5^circtextC$5^{\circ}\text{C}$. The specific heat of air at constant volume is 0.17text kcal/kg^circtextC$0.17\text{ kcal/kg}^{\circ}\text{C}$ and J = 4.18text joule/cal$J = 4.18\text{ joule/cal}$. The change in its internal energy is approximately:
A.318text J$318\text{ J}$
B.298text J$298\text{ J}$
C.284text J$284\text{ J}$
D.142text J$142\text{ J}$
Solution & Explanation
### Related Formula
Q = Delta U + W$Q = \Delta U + W$
Since the volume is constant, work done W = 0$W = 0$, leading to:
Delta U = Q = m c_v Delta T$\Delta U = Q = m c_v \Delta T$
### Core Logic
Given values:
m = 0.08text kg$m = 0.08\text{ kg}$c_v = 0.17text kcal/kg^circtextC = 0.17 times 10^3text cal/kg^circtextC$c_v = 0.17\text{ kcal/kg}^{\circ}\text{C} = 0.17 \times 10^3\text{ cal/kg}^{\circ}\text{C}$Delta T = 5^circtextC$\Delta T = 5^{\circ}\text{C}$J = 4.18text J/cal$J = 4.18\text{ J/cal}$
### Step 1: Metric conversion and computing value
Delta U = 0.08 times (0.17 times 10^3) times 5 times 4.18$\Delta U = 0.08 \times (0.17 \times 10^3) \times 5 \times 4.18$Delta U = 0.08 times 170 times 5 times 4.18$\Delta U = 0.08 \times 170 \times 5 \times 4.18$Delta U = 68 times 4.18 simeq 284.24text J approx 284text J$\Delta U = 68 \times 4.18 \simeq 284.24\text{ J} \approx 284\text{ J}$
### Pattern Recognition
Isochoric processes channel total thermal input strictly into core state configurations, converting raw metric calories directly to standard mechanical Joules via mechanical equivalent factors (J$J$).
### Evaluation Rubric / Model Answer
null
### Chapter Mix
Class 11 Physics: Thermodynamics
Keywords:#air is heated at constant volume#JEE Main 2024 Morning Q40#Thermodynamics JEE Main 2024#First Law of Thermodynamics JEE Main 2024
More Thermodynamics Previous-Year Questions — Page 5
Q46jee_main_2024_29_jan_morningWork Done in a Thermodynamic Process
A thermodynamic system is taken from an original state A to an intermediate state B by a linear process as shown in the figure. It's volume is then reduced to the original value from B to C by an isobaric process. The total work done by the gas from A to B and B to C would be:
The graph plots Pressure (Dyne/cm^2) on the y-axis (with coordinates at 4000 and 8000) versus Volume (m^3) on the x-axis (with marks at 3 and 7). State path goes linearly from A to B, then horizontally from B to C.
A.33800 mathrm~J$33800 \mathrm{~J}$
B.2200 mathrm~J$2200 \mathrm{~J}$
C.600 mathrm~J$600 \mathrm{~J}$
D.1200 mathrm~J$1200 \mathrm{~J}$
Solution
### Related Formula
Work done (W$W$) in a thermodynamic process corresponds to the area under the curve on a P-V$P-V$ diagram:
W = int P \, dV$W = \int P \, dV$
### Core Logic
Let's compute the work done along the distinct steps AB$AB$ and BC$BC$ matching the values shown in the graph:
From graph coordinates:
P_A = 8000 mathrm~Dyne/cm^2, quad V_A = 3 mathrm~m^3$P_A = 8000 \mathrm{~Dyne/cm^2}, \quad V_A = 3 \mathrm{~m^3}$P_B = 4000 mathrm~Dyne/cm^2, quad V_B = 7 mathrm~m^3$P_B = 4000 \mathrm{~Dyne/cm^2}, \quad V_B = 7 \mathrm{~m^3}$P_C = 4000 mathrm~Dyne/cm^2, quad V_C = 3 mathrm~m^3$P_C = 4000 \mathrm{~Dyne/cm^2}, \quad V_C = 3 \mathrm{~m^3}$The graph plots Pressure (Dyne/cm^2) on the y-axis (with coordinates at 4000 and 8000) versus Volume (m^3) on the x-axis (with marks at 3 and 7). State path goes linearly from A to B, then horizontally from B to C.
### Step 1: Calculate Work Done in Process AB
Process AB$AB$ is a linear expansion. Fulfilling the area of the trapezoid underneath path AB$AB$:
W_AB = frac12 (P_A + P_B) Delta V_AB$W_{AB} = \frac{1}{2} (P_A + P_B) \Delta V_{AB}$W_AB = frac12 (8000 + 4000) mathrm~Dyne/cm^2 times (7 - 3) mathrm~m^3$W_{AB} = \frac{1}{2} (8000 + 4000) \mathrm{~Dyne/cm^2} \times (7 - 3) \mathrm{~m^3}$W_AB = 6000 times 4 = 24000 mathrm~Dyne/cm^2 cdot mathrmm^3$W_{AB} = 6000 \times 4 = 24000 \mathrm{~Dyne/cm^2} \cdot \mathrm{m^3}$
### Step 2: Calculate Work Done in Process BC
Process BC$BC$ is an isobaric compression at P = 4000 mathrm~Dyne/cm^2$P = 4000 \mathrm{~Dyne/cm^2}$:
W_BC = P_B cdot (V_C - V_B) = 4000 times (3 - 7) = -16000 mathrm~Dyne/cm^2 cdot mathrmm^3$W_{BC} = P_B \cdot (V_C - V_B) = 4000 \times (3 - 7) = -16000 \mathrm{~Dyne/cm^2} \cdot \mathrm{m^3}$
### Step 3: Total Work and Unit Conversion
Net work done is:
W_texttotal = W_AB + W_BC = 24000 - 16000 = 8000 mathrm~Dyne/cm^2 cdot mathrmm^3$W_{\text{total}} = W_{AB} + W_{BC} = 24000 - 16000 = 8000 \mathrm{~Dyne/cm^2} \cdot \mathrm{m^3}$
Converting units to Joules (1 mathrm~N/m^2 = 10 mathrm~Dyne/cm^2 implies 1 mathrm~Dyne/cm^2 = 0.1 mathrm~N/m^2$1 \mathrm{~N/m^2} = 10 \mathrm{~Dyne/cm^2} \implies 1 \mathrm{~Dyne/cm^2} = 0.1 \mathrm{~N/m^2}$):
W_texttotal = 8000 times (0.1 mathrm~N/m^2) cdot mathrmm^3 = 800 mathrm~J$W_{\text{total}} = 8000 \times (0.1 \mathrm{~N/m^2}) \cdot \mathrm{m^3} = 800 \mathrm{~J}$
Since 800 mathrm~J$800 \mathrm{~J}$ is not present in the options, this question was declared a **BONUS**.
### Pattern Recognition
Always be highly vigilant of mixed unit systems in thermodynamic graphics. Here, pressure is in CGS (textDyne/cm^2$\text{Dyne/cm}^2$) while volume is in MKS (textm^3$\text{m}^3$). Converting early keeps you clear of algebraic traps.
### Evaluation Rubric / Model Answer
null
### Chapter Mix
Class 11 Physics: Thermodynamics
Q36jee_main_2024_30_january_eveningIsothermal and Adiabatic Processes
Choose the correct statement for processes mathrmA$\mathrm{A}$ & mathrmB$\mathrm{B}$ shown in figure.
A Pressure vs Volume (P-V) graph showing two expansion curves starting from the same initial state. Curve B is steeper than Curve A.
A.mathrmPV^gamma = mathrmk text for process mathrmB text and mathrmPV = mathrmk text for process mathrmA$\mathrm{PV}^{\gamma} = \mathrm{k} \text{ for process } \mathrm{B} \text{ and } \mathrm{PV} = \mathrm{k} \text{ for process } \mathrm{A}$
B.mathrmPV = mathrmk text for process mathrmB text and mathrmA$\mathrm{PV} = \mathrm{k} \text{ for process } \mathrm{B} \text{ and } \mathrm{A}$
C.fracmathrmP^gamma - 1mathrmT^gamma = mathrmk text for process mathrmB text and mathrmT = mathrmk text for process mathrmA$\frac{\mathrm{P}^{\gamma - 1}}{\mathrm{T}^{\gamma}} = \mathrm{k} \text{ for process } \mathrm{B} \text{ and } \mathrm{T} = \mathrm{k} \text{ for process } \mathrm{A}$
D.fracmathrmT^gammamathrmP^gamma - 1 = mathrmk text for process mathrmA text and mathrmPV = mathrmk text for process mathrmB$\frac{\mathrm{T}^{\gamma}}{\mathrm{P}^{\gamma - 1}} = \mathrm{k} \text{ for process } \mathrm{A} \text{ and } \mathrm{PV} = \mathrm{k} \text{ for process } \mathrm{B}$
Solution
### Related Formula
textIsothermal: PV = textconstant$\text{Isothermal: } PV = \text{constant}$textAdiabatic: PV^gamma = textconstant$\text{Adiabatic: } PV^{\gamma} = \text{constant}$textAdiabatic T-P relation: T^gamma P^1-gamma = textconstant implies fracT^gammaP^gamma - 1 = textconstant$\text{Adiabatic T-P relation: } T^{\gamma} P^{1-\gamma} = \text{constant} \implies \frac{T^{\gamma}}{P^{\gamma - 1}} = \text{constant}$
### Core Logic
In a P-V$P-V$ diagram starting from the same initial state and undergoing expansion, the adiabatic curve is steeper than the isothermal curve.
Looking at the graph, Curve (B) is steeper, so it represents an adiabatic process. Curve (A) is less steep, so it represents an isothermal process.
### Step 1: Check Options
Process A (Isothermal): PV = k$PV = k$ or T = k$T = k$.
Process B (Adiabatic): PV^gamma = k$PV^{\gamma} = k$.
Option (1) states: PV^gamma = k$PV^{\gamma} = k$ for B and PV = k$PV = k$ for A. This is entirely correct.
Note: For an adiabatic process, T^gamma P^1-gamma = k$T^{\gamma} P^{1-\gamma} = k$, which can be written as fracT^gammaP^gamma-1 = k$\frac{T^{\gamma}}{P^{\gamma-1}} = k$. Option (3) proposes fracP^gamma-1T^gamma = k$\frac{P^{\gamma-1}}{T^{\gamma}} = k$ for B, which is mathematically equivalent, but Option (1) is the standard and most direct NTA choice.
### Pattern Recognition
Slope of isothermal = -P/V$= -P/V$. Slope of adiabatic = -gamma P/V$= -\gamma P/V$. Since gamma > 1$\gamma > 1$, adiabatic is always steeper. In expansions, adiabatic lies below isothermal.
### Evaluation Rubric / Model Answer
null
### Chapter Mix
Class 11 Physics: Thermodynamics
Q45jee_main_2024_30_jan_morningPolytropic Processes and Heat Capacity
Two thermodynamical process are shown in the figure. The molar heat capacity for process A and B are C_A$C_A$ and C_B$C_B$. The molar heat capacity at constant pressure and constant volume are represented by C_P$C_P$ and C_V$C_V$, respectively. Choose the correct statement.
A plot of log P versus log V for two processes A and B.
A.C_B = infty , C_A = 0$C_B = \infty , C_A = 0$
B.C_A = 0 text and C_B = infty$C_A = 0 \text{ and } C_B = \infty$
C.C_P > C_V > C_A = C_B$C_P > C_V > C_A = C_B$
D.C_A > C_P > C_V$C_A > C_P > C_V$
Solution
### Related Formula
C = C_v + fracR1 - n quad (textfor PV^n = textconst)$C = C_v + \frac{R}{1 - n} \quad (\text{for } PV^n = \text{const})$textIf P = k V^x, text then n = -x$\text{If } P = k V^x, \text{ then } n = -x$
### Core Logic
For a generic straight line on a log P$\log P$ vs log V$\log V$ plot, the slope defines the exponent.
log P = x log V + c Rightarrow P = V^x cdot e^c Rightarrow PV^-x = textConstant$\log P = x \log V + c \Rightarrow P = V^x \cdot e^c \Rightarrow PV^{-x} = \text{Constant}$.
The molar heat capacity is computed using n = -x$n = -x$.
### Step 1: Evaluate Process A
For process A: slope = gamma$= \gamma$ (given tan theta > 1$\tan \theta > 1$).
log P = gamma log V Rightarrow PV^-gamma = textConstant quad (texthere n = -gamma)$\log P = \gamma \log V \Rightarrow PV^{-\gamma} = \text{Constant} \quad (\text{here } n = -\gamma)$C_A = C_V + fracR1 - (-gamma) = C_V + fracR1 + gamma quad dots (i)$C_A = C_V + \frac{R}{1 - (-\gamma)} = C_V + \frac{R}{1 + \gamma} \quad \dots (i)$
### Step 2: Evaluate Process B
For process B: slope = 1$= 1$ (given tan 45^circ = 1$\tan 45^\circ = 1$).
log P = 1 cdot log V Rightarrow PV^-1 = textConstant quad (texthere n = -1)$\log P = 1 \cdot \log V \Rightarrow PV^{-1} = \text{Constant} \quad (\text{here } n = -1)$C_B = C_v + fracR1 - (-1) = C_v + fracR2 quad dots (ii)$C_B = C_v + \frac{R}{1 - (-1)} = C_v + \frac{R}{2} \quad \dots (ii)$
### Step 3: Analyze Heat Capacities
We also know:
C_P = C_v + R quad dots (iii)$C_P = C_v + R \quad \dots (iii)$
Comparing (i), (ii), and (iii):
Since gamma > 1$\gamma > 1$ for process A, fracR1+gamma < fracR2$\frac{R}{1+\gamma} < \frac{R}{2}$.
Thus, C_P > C_B > C_A > C_v$C_P > C_B > C_A > C_v$.
Note: Ans. By NTA (1 or 2). Ans. By our answer (Bonus). Since no option fully matches the mathematical derivation C_P > C_B > C_A > C_v$C_P > C_B > C_A > C_v$, this was treated as a bonus or flawed option set. We assign index 0 based on official NTA preliminary keys marking 1 or 2.
### Pattern Recognition
Slopes on a log-log PV plot represent the polytropic exponent modifier. Positive slopes imply -n > 0$-n > 0$, pulling heat capacity structurally between C_v$C_v$ and C_P$C_P$.
### Evaluation Rubric / Model Answer
null
### Chapter Mix
Class 11 Physics: Thermodynamics
Q38jee_main_2024_31_jan_morningIsobaric Process
The given figure represents two isobaric processes for the same mass of an ideal gas, then
A Volume vs Temperature (V-T) graph showing two straight lines starting from the origin representing distinct constant pressures P1 and P2.
### Related Formula
PV = nRT$PV = nRT$
### Core Logic
From the Ideal Gas Law:
V = left(fracnRPright) T$V = \left(\frac{nR}{P}\right) T$
In a V-T$V-T$ graph, the equation of the line represents y = mx$y = mx$, where the slope m$m$ is:
textSlope = fracnRP$\text{Slope} = \frac{nR}{P}$textSlope propto frac1P$\text{Slope} \propto \frac{1}{P}$
Thus, a higher slope corresponds to a lower pressure.
### Step 2: Compare Slopes
From the given figure, the slope of line 2 is greater than the slope of line 1:
(textSlope)_2 > (textSlope)_1$(\text{Slope})_2 > (\text{Slope})_1$
Therefore, inversely:
P_2 < P_1$P_2 < P_1$
or P_1 > P_2$P_1 > P_2$.
### Pattern Recognition
In V-T graphs, steeper lines mean lower Pressure. In P-T graphs, steeper lines mean lower Volume. It's an inverse inverse slope relationship.
### Evaluation Rubric / Model Answer
null
### Chapter Mix
Class 11 Physics: Thermodynamics
More Thermodynamics Questions — jee_main_2024_27_jan_morning
We Map Every Repeating Question in Competitive Exams.
Say goodbye to generic mock test fatigue. RankBit uses smart analysis to group past exam questions into their foundational Repeating Question Types. Find chapter weightage, track repeating questions, and score higher with targeted practice.
Select Your Target Exam
Choose an exam track below to find formulas per chapter and patterns.
Syncing Exam Intelligence
Mapping formulas and patterns across all tracks…
PATH A — FULL LENGTH PRACTICE
Full Mock Test Hub
Simulate real NTA exam conditions with fully tracked mocks. Time yourself against past papers.
Under Development
PATH B — TARGETED PRACTICE
Topic-wise Practice Hub
Practice past-year questions one chapter at a time. Pick an exam → subject → chapter and get every PYQ for that topic — pulled together from all past papers — with the chapter's key formulas alongside.