Related Formula
W = ∫ p dV$$W = \int p \, dV$$
Core Logic
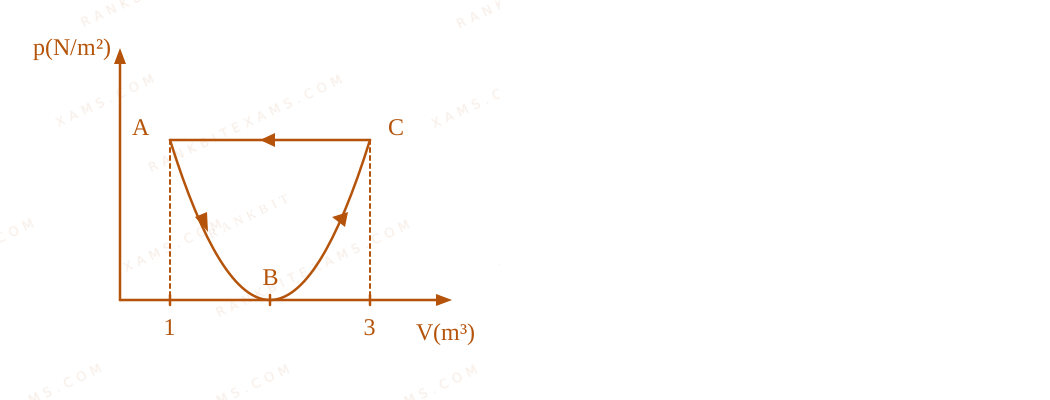
The total work done in a cyclic process is the enclosed area. The cycle is clockwise, but wait—the arrows in the diagram point anti-clockwise (A to B to C and back to A via horizontal top line). Anti-clockwise cycle means negative work. The enclosed area is bounded by a parabola.
Step 1: Identifying the Parabola Parameters
Equation of curve: (V - 2)² = 4ap$(V - 2)^2 = 4ap$
This is an upward-opening parabola with vertex at V = 2$V = 2$, p = 0$p = 0$ (assuming a>0$a>0$).
Let's check points A (V=1$V=1$) and C (V=3$V=3$).
At V=1$V=1$: (1 - 2)² = 4ap ⇒ 1 = 4ap₀ ⇒ p₀ = (1)/(4a)$(1 - 2)^2 = 4ap \Rightarrow 1 = 4ap_0 \Rightarrow p_0 = \frac{1}{4a}$
At V=3$V=3$: (3 - 2)² = 4ap ⇒ 1 = 4ap₀ ⇒ p₀ = (1)/(4a)$(3 - 2)^2 = 4ap \Rightarrow 1 = 4ap_0 \Rightarrow p_0 = \frac{1}{4a}$
So the top horizontal line is at p₀ = (1)/(4a)$p_0 = \frac{1}{4a}$.
Step 2: Area Calculation
The enclosed shape is bounded by the line p = p₀$p = p_0$ and the parabola p = ((V - 2)²)/(4a)$p = \frac{(V - 2)^2}{4a}$.
The area of a parabolic segment (bounded by a chord) is (2)/(3) × Area of enclosing rectangle$\frac{2}{3} \times \text{Area of enclosing rectangle}$.
Rectangle width = Δ V = 3 - 1 = 2$\Delta V = 3 - 1 = 2$.
Rectangle height = p₀ - 0 = p₀$p_0 - 0 = p_0$.
Area = (2)/(3) × (p₀) × (2) = (4p₀)/(3)$\frac{2}{3} \times (p_0) \times (2) = \frac{4p_0}{3}$.
Step 3: Substitute and Determine Sign
Substitute p₀ = (1)/(4a)$p_0 = \frac{1}{4a}$:
|W| = (4)/(3) ((1)/(4a)) = (1)/(3a)$$|W| = \frac{4}{3} \left(\frac{1}{4a}\right) = \frac{1}{3a}$$
The cycle is counter-clockwise, so the net work done by the gas is negative.
Wgas = -(1)/(3a)$$W_{\text{gas}} = -\frac{1}{3a}$$
Pattern Recognition
For parabolic curves y = kx²$y = kx^2$, the area inside the 'bowl' up to a chord is 2/3$2/3$ of the bounding rectangle. Direction of arrows dictates the sign: clockwise = positive, anti-clockwise = negative.
Chapter Mix
Class 11 Physics: Thermodynamics