
Solution
Core Logic
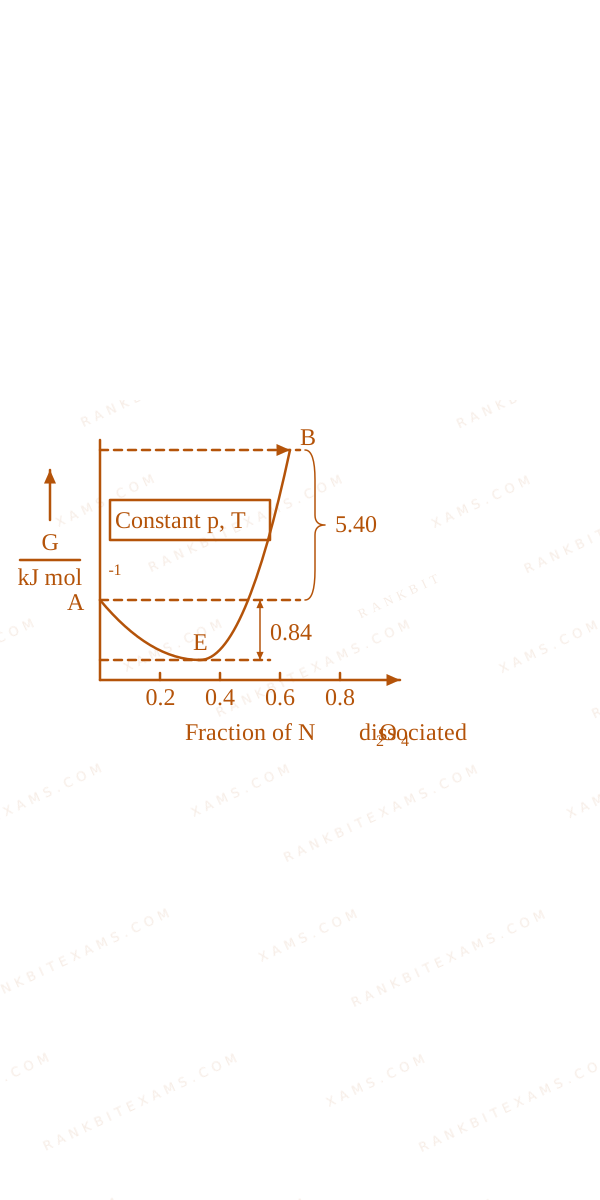
Let's analyze the statements based on the given Gibbs free energy (G) vs. extent of reaction plot.
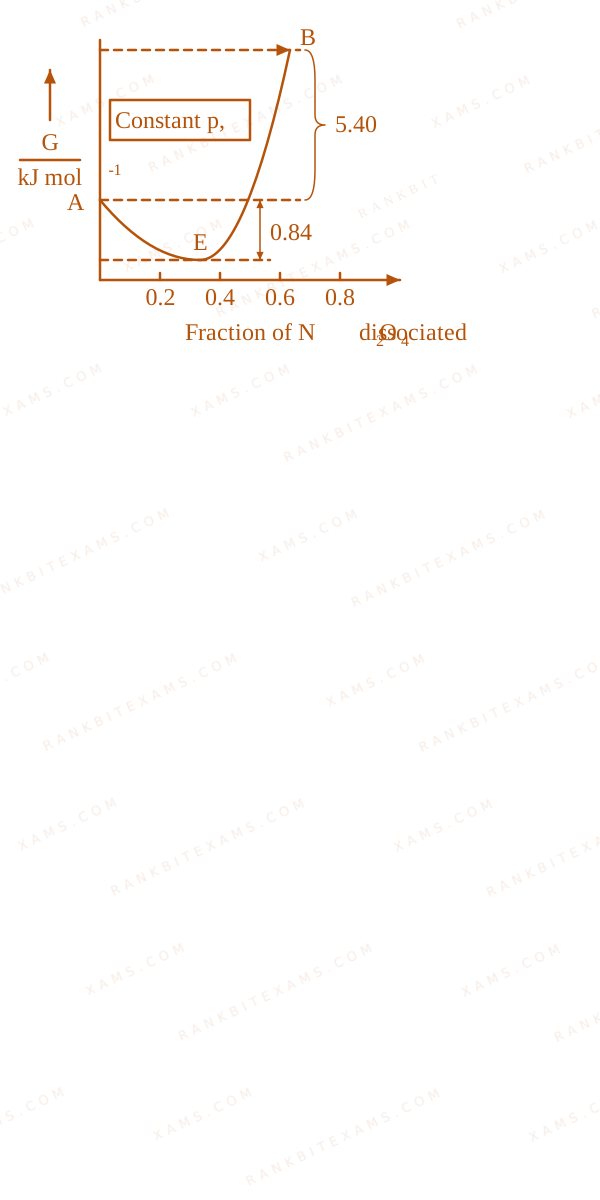
A. Standard free energy change (Δᵣ G°) is the difference between standard free energies of pure products (point B) and pure reactants (point A): Δᵣ G° = GB° - GA°. Since B is higher than A, Δᵣ G° is positive, not -5.40 kJ mol⁻¹. Statement A is false.
B. Even if Δᵣ G° is positive, the minimum of the curve (equilibrium state E) lies between the pure reactant and product states. Therefore, partial dissociation occurs to reach equilibrium. It is false to say it will not dissociate at all. Statement B is false.
C. The minimum E is not at fraction = 0 or 1, meaning an equilibrium mixture exists. Reverse reaction does not go to completion. Statement C is false.
D. From 1 mole of pure reactant (point A) to the equilibrium mixture (point E), the drop in Gibbs energy is 0.84 kJ mol⁻¹. Thus Δ G = -0.84 kJ mol⁻¹ is correct. Statement D is true.
E. The difference from pure products (point B, equivalent to 2 moles NO₂) to equilibrium (E) is the entire vertical distance. The drop from B to A is 5.40, and A to E is 0.84. So drop from B to E is - (5.40 + 0.84) = -6.24 kJ mol⁻¹. Statement E is true.
Step 1: Final Conclusion
Only statements D and E are correct.
Pattern Recognition
The free energy of mixing creates a minimum 'dip' (Equilibrium) below both pure reactants and pure products, preventing either forward or reverse reactions from going absolutely to 100% completion.
Chapter Mix
Class 11 Chemistry: Thermodynamics Class 11 Chemistry: Equilibrium