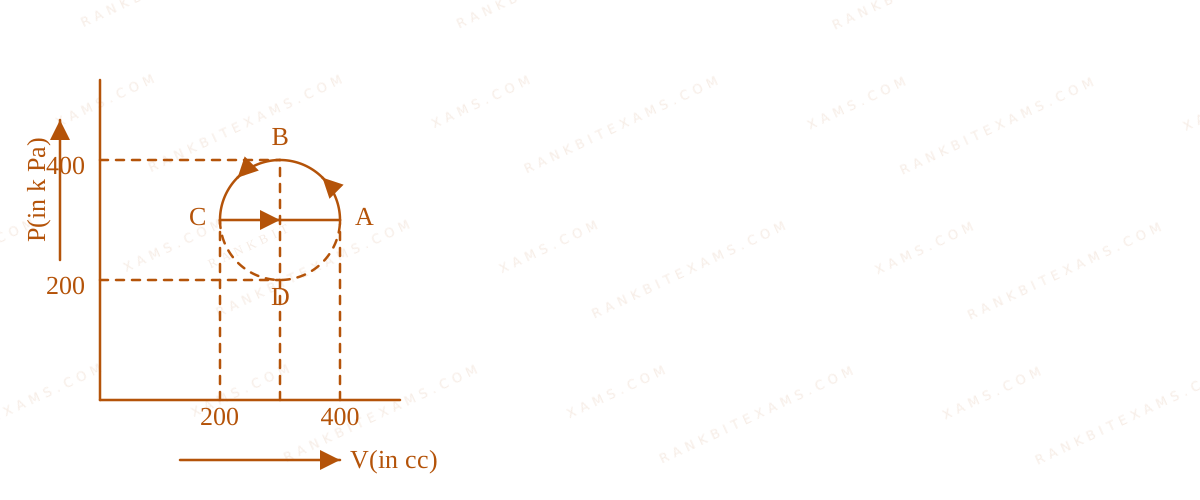
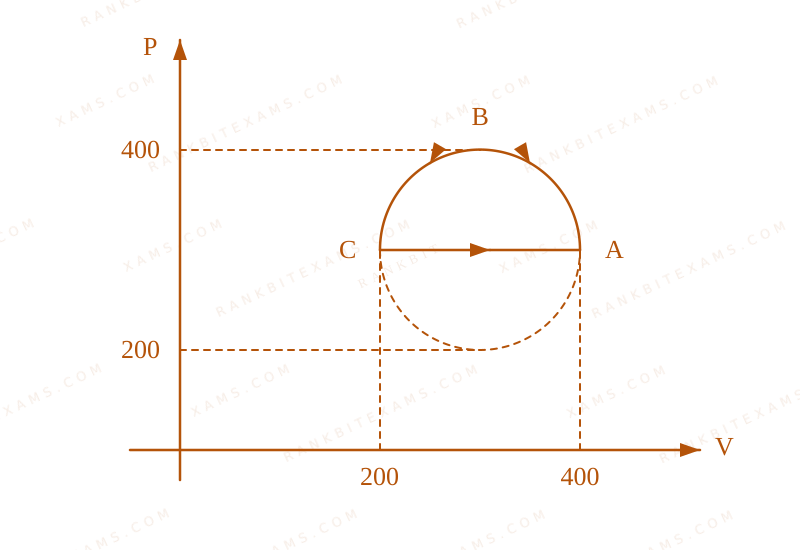
The magnitude of heat exchanged by a system for the given cyclic process ABCA (as shown in figure The image shows a P-V cycle consisting of a horizontal line from C to A and a semicircular loop from A back to C via B.) is (in SI unit)
A.10π$10\pi$
B.5π$5\pi$
C.zero
D.40π$40\pi$
Solution & Explanation
Related Formula
From the first law of thermodynamics for a complete cycle:
Δ U = 0 Q = W = Area of the loop$$\Delta U = 0 \implies Q = W = \text{Area of the loop}$$
Core Logic
The graph shows a semicircle in a P-V$P\text{-}V$ indicator diagram. The image shows a P-V cycle consisting of a horizontal line from C to A and a semicircular loop from A back to C via B.
Since Q = W$Q = W$, the heat exchanged has a magnitude of 5π J$5\pi\ \mathrm{J}$.
Pattern Recognition
For a cycle on an indicator chart with mismatched scales, use the elliptic area template π a b$\pi a b$ (or (1)/(2)π a b$\frac{1}{2}\pi a b$ for a half-ellipse/semicircle).
Keywords:#Work done in cyclic process PV diagram#JEE Main 2025 Evening Q13#First law of thermodynamics cycle#Semicircle area scaling#PV diagram work done#cyclic process heat#thermodynamics cycle
More Thermodynamics Previous-Year Questions — Page 8
Qjee_main_2024_31_jan_morningIsobaric Process
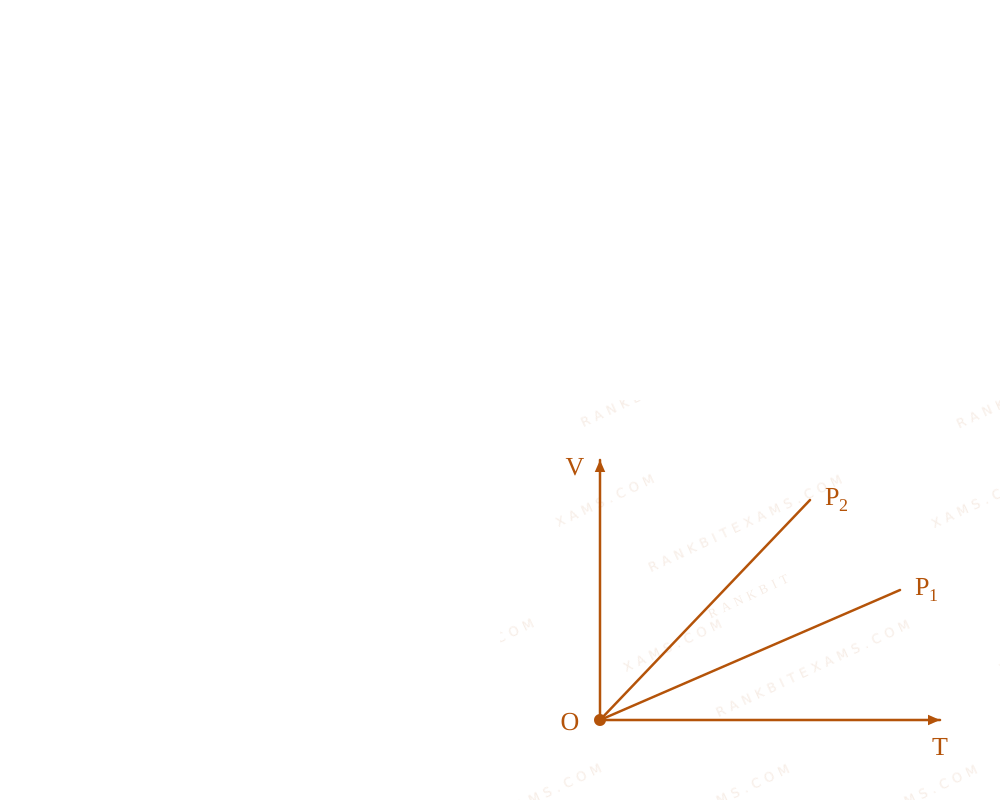
The given figure represents two isobaric processes for the same mass of an ideal gas, then
A Volume vs Temperature (V-T) graph showing two straight lines starting from the origin representing distinct constant pressures P1 and P2.
A.P₂≥ P₁$\mathrm{P}_2\geq \mathrm{P}_1$
B.P₂ > P₁$\mathrm{P}_2 > \mathrm{P}_1$
C.P₁ = P₂$\mathrm{P_1 = P_2}$
D.P₁ > P₂$\mathrm{P}_1 > \mathrm{P}_2$
Solution
Related Formula
PV = nRT$PV = nRT$
Core Logic
From the Ideal Gas Law:
V = ((nR)/(P)) T$$V = \left(\frac{nR}{P}\right) T$$
In a V-T$V-T$ graph, the equation of the line represents y = mx$y = mx$, where the slope m$m$ is:
Practice past-year questions one chapter at a time. Pick an exam → subject → chapter and get every PYQ for that topic — pulled together from all past papers — with the chapter's key formulas alongside.