An ideal gas has undergone through the cyclic process as shown in the figure. Work done by the gas in the entire cycle is × 10⁻¹$\times 10^{-1}$ J. (Take π = 3.14$\pi = 3.14$ )
A cycle plot in which the volume lies in cm^3 (150 to 350) and pressure is in kPa (300 to 500), forming an ellipse.
Numerical Answer Type:
Enter a numerical valueAnswer: 314 to 314+4 marks
Solution & Explanation
Related Formula
The work done W$W$ in a cyclic thermodynamic process is equal to the area enclosed by the loop on a Pressure-Volume (P-V$P-V$) diagram:
W = Area of Closed Loop$$W = \text{Area of Closed Loop}$$
For an ellipse with semi-major axis a$a$ and semi-minor axis b$b$:
Area = π a b$$\text{Area} = \pi a b$$
Core Logic
Determine the semi-axes of the elliptical cycle on the P-V$P-V$ plane:
Sees: Circular/elliptical thermodynamic cycle.
Shortcut: Work done is always π Δ P Δ V / 4$\pi \Delta P \Delta V / 4$. Simply compute the semi-axes difference 100 ~kPa$100 \mathrm{~kPa}$ and 100 ~cm³$100 \mathrm{~cm^3}$ and multiply by π$\pi$ directly, keeping tracking of metric prefixes (10³ × 10⁻⁶ = 10⁻³$10^3 \times 10^{-6} = 10^{-3}$).
Chapter Mix
Class 11 Physics: Thermodynamics
A cycle plot in which the volume lies in cm^3 (150 to 350) and pressure is in kPa (300 to 500), forming an ellipse.
Keywords:#PV diagram#cyclic process work done#ellipse area#gas thermodynamics
More Thermodynamics Previous-Year Questions — Page 8
Qjee_main_2024_31_jan_morningIsobaric Process
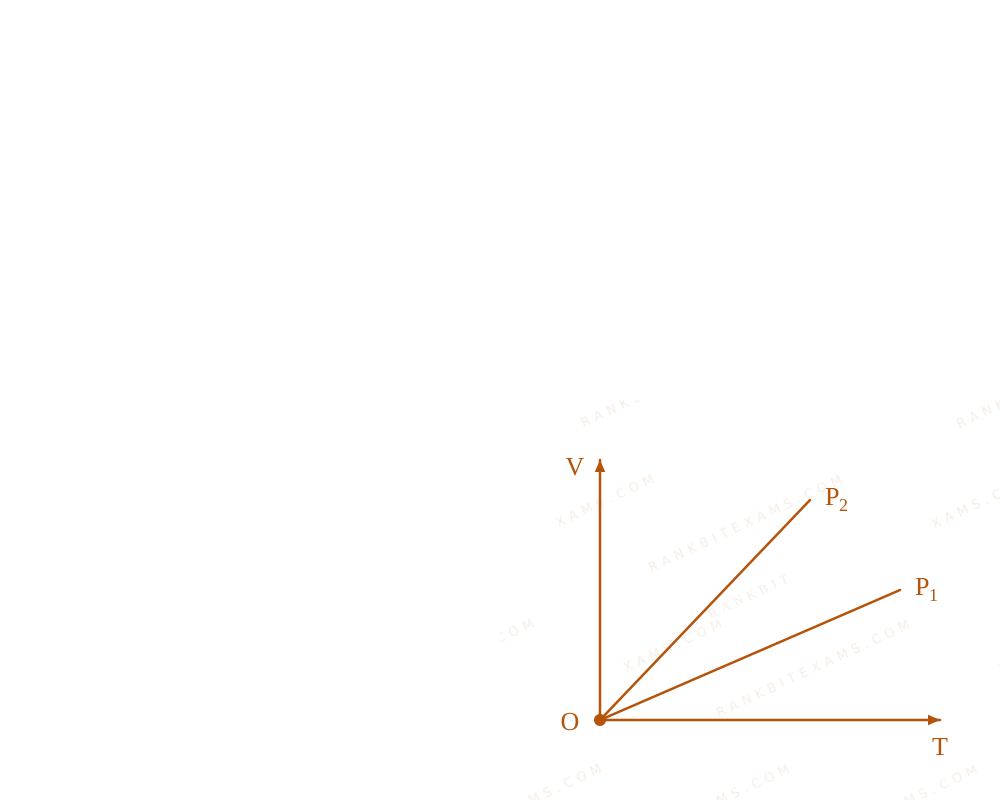
The given figure represents two isobaric processes for the same mass of an ideal gas, then
A Volume vs Temperature (V-T) graph showing two straight lines starting from the origin representing distinct constant pressures P1 and P2.
A.P₂≥ P₁$\mathrm{P}_2\geq \mathrm{P}_1$
B.P₂ > P₁$\mathrm{P}_2 > \mathrm{P}_1$
C.P₁ = P₂$\mathrm{P_1 = P_2}$
D.P₁ > P₂$\mathrm{P}_1 > \mathrm{P}_2$
Solution
Related Formula
PV = nRT$PV = nRT$
Core Logic
From the Ideal Gas Law:
V = ((nR)/(P)) T$$V = \left(\frac{nR}{P}\right) T$$
In a V-T$V-T$ graph, the equation of the line represents y = mx$y = mx$, where the slope m$m$ is:
Practice past-year questions one chapter at a time. Pick an exam → subject → chapter and get every PYQ for that topic — pulled together from all past papers — with the chapter's key formulas alongside.