
SYSTEM
Syllabus Analysis & Trend Mapping
Thermodynamics appeared 36 times across 3 years — 4.2% of Physics. This question is from Isobaric Process.
PV = nRT
From the Ideal Gas Law:
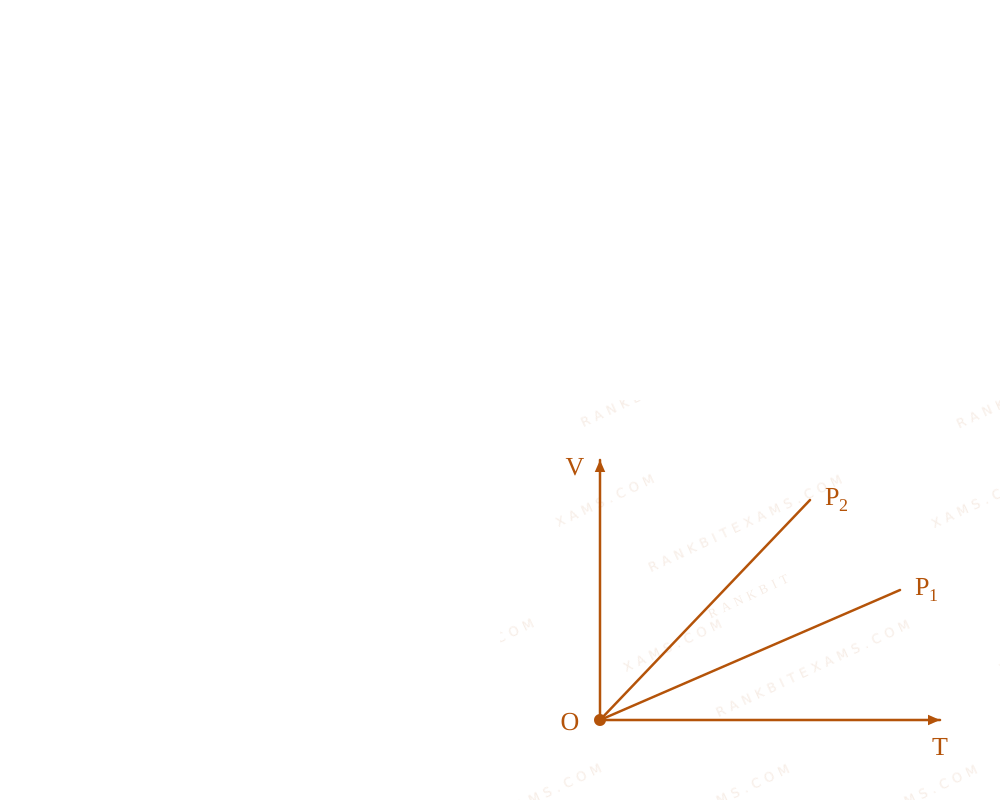
V = ((nR)/(P)) TIn a V-T graph, the equation of the line represents y = mx, where the slope m is:
Slope = (nR)/(P) Slope ∝ (1)/(P)Thus, a higher slope corresponds to a lower pressure.
From the given figure, the slope of line 2 is greater than the slope of line 1:
(Slope)₂ > (Slope)₁Therefore, inversely: P₂ < P₁ or P₁ > P₂.
In V-T graphs, steeper lines mean lower Pressure. In P-T graphs, steeper lines mean lower Volume. It's an inverse inverse slope relationship.
Class 11 Physics: Thermodynamics
Practice all Thermodynamics previous-year questions →
Syllabus Analysis & Trend Mapping
Choose an exam track below to find formulas per chapter and patterns.
Syncing Exam Intelligence
Mapping formulas and patterns across all tracks…
Simulate real NTA exam conditions with fully tracked mocks. Time yourself against past papers.
Practice past-year questions one chapter at a time. Pick an exam → subject → chapter and get every PYQ for that topic — pulled together from all past papers — with the chapter's key formulas alongside.
Chapter weightage trends and topic-wise practice — all mapped from past shift papers.
See high-yield chapters, year-wise counts and the frequency-based chance each topic repeats next exam.
Every past-year question for a chapter pulled from all papers, with its key formulas alongside.
Loading articles...
Select a specific exam paper to view its topic-wise syllabus weightage, formula trends, and practice interactive questions.
We analyzed past shift papers to map these topics. Select a chapter to start targeted practice.
ACTIVE SUBJECT
Physics
No chapters or subjects match your search.
Test your concepts live. Choose options or enter numerical values, then verify your answer to reveal the double-box solution matrix.
Practice all questionsPlease select a specific exam shift from the dashboard to unlock data-driven insights and practice materials.