Choose the correct statement for processes A$\mathrm{A}$ & B$\mathrm{B}$ shown in figure.
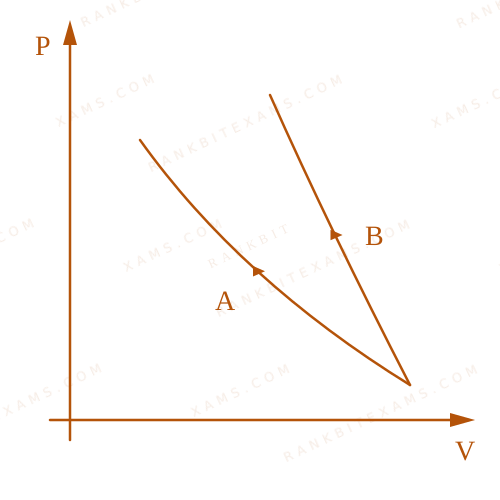
A Pressure vs Volume (P-V) graph showing two expansion curves starting from the same initial state. Curve B is steeper than Curve A.
A.PVγ = k for process B and PV = k for process A$\mathrm{PV}^{\gamma} = \mathrm{k} \text{ for process } \mathrm{B} \text{ and } \mathrm{PV} = \mathrm{k} \text{ for process } \mathrm{A}$
B.PV = k for process B and A$\mathrm{PV} = \mathrm{k} \text{ for process } \mathrm{B} \text{ and } \mathrm{A}$
C.Pγ - 1Tγ = k for process B and T = k for process A$\frac{\mathrm{P}^{\gamma - 1}}{\mathrm{T}^{\gamma}} = \mathrm{k} \text{ for process } \mathrm{B} \text{ and } \mathrm{T} = \mathrm{k} \text{ for process } \mathrm{A}$
D.TγPγ - 1 = k for process A and PV = k for process B$\frac{\mathrm{T}^{\gamma}}{\mathrm{P}^{\gamma - 1}} = \mathrm{k} \text{ for process } \mathrm{A} \text{ and } \mathrm{PV} = \mathrm{k} \text{ for process } \mathrm{B}$
In a P-V$P-V$ diagram starting from the same initial state and undergoing expansion, the adiabatic curve is steeper than the isothermal curve.
Looking at the graph, Curve (B) is steeper, so it represents an adiabatic process. Curve (A) is less steep, so it represents an isothermal process.
Step 1: Check Options
Process A (Isothermal): PV = k$PV = k$ or T = k$T = k$.
Process B (Adiabatic): PVγ = k$PV^{\gamma} = k$.
Option (1) states: PVγ = k$PV^{\gamma} = k$ for B and PV = k$PV = k$ for A. This is entirely correct.
Note: For an adiabatic process, Tγ P1-γ = k$T^{\gamma} P^{1-\gamma} = k$, which can be written as TγPγ-1 = k$\frac{T^{\gamma}}{P^{\gamma-1}} = k$. Option (3) proposes Pγ-1Tγ = k$\frac{P^{\gamma-1}}{T^{\gamma}} = k$ for B, which is mathematically equivalent, but Option (1) is the standard and most direct NTA choice.
Pattern Recognition
Slope of isothermal = -P/V$= -P/V$. Slope of adiabatic = -γ P/V$= -\gamma P/V$. Since γ > 1$\gamma > 1$, adiabatic is always steeper. In expansions, adiabatic lies below isothermal.
Practice past-year questions one chapter at a time. Pick an exam → subject → chapter and get every PYQ for that topic — pulled together from all past papers — with the chapter's key formulas alongside.