Related Formula
C = Cv + (R)/(1 - n) (for PVⁿ = const)$$C = C_v + \frac{R}{1 - n} \quad (\text{for } PV^n = \text{const})$$
If P = k V^x, then n = -x$$\text{If } P = k V^x, \text{ then } n = -x$$
Core Logic
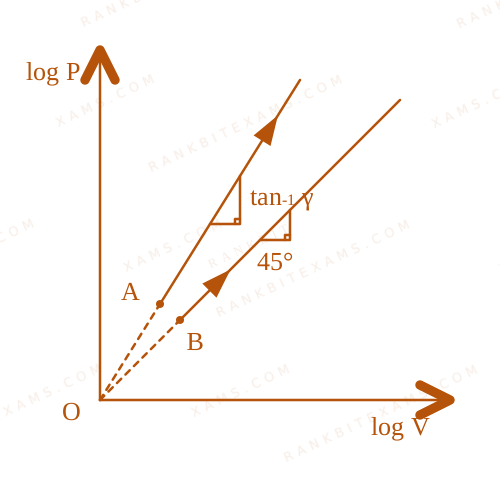
For a generic straight line on a P$\log P$ vs V$\log V$ plot, the slope defines the exponent.
P = x V + c ⇒ P = V^x · e^c ⇒ PV-x = Constant$\log P = x \log V + c \Rightarrow P = V^x \cdot e^c \Rightarrow PV^{-x} = \text{Constant}$.
The molar heat capacity is computed using n = -x$n = -x$.
Step 1: Evaluate Process A
For process A: slope = γ$= \gamma$ (given θ > 1$\tan \theta > 1$).
P = γ V ⇒ PV-γ = Constant (here n = -γ)$$\log P = \gamma \log V \Rightarrow PV^{-\gamma} = \text{Constant} \quad (\text{here } n = -\gamma)$$
CA = CV + (R)/(1 - (-γ)) = CV + (R)/(1 + γ) (i)$$C_A = C_V + \frac{R}{1 - (-\gamma)} = C_V + \frac{R}{1 + \gamma} \quad \dots (i)$$
Step 2: Evaluate Process B
For process B: slope = 1$= 1$ (given 45^° = 1$\tan 45^\circ = 1$).
P = 1 · V ⇒ PV⁻¹ = Constant (here n = -1)$$\log P = 1 \cdot \log V \Rightarrow PV^{-1} = \text{Constant} \quad (\text{here } n = -1)$$
CB = Cv + (R)/(1 - (-1)) = Cv + (R)/(2) (ii)$$C_B = C_v + \frac{R}{1 - (-1)} = C_v + \frac{R}{2} \quad \dots (ii)$$
Step 3: Analyze Heat Capacities
We also know:
CP = Cv + R (iii)$$C_P = C_v + R \quad \dots (iii)$$
Comparing (i), (ii), and (iii):
Since γ > 1$\gamma > 1$ for process A, (R)/(1+γ) < (R)/(2)$\frac{R}{1+\gamma} < \frac{R}{2}$.
Thus, CP > CB > CA > Cv$C_P > C_B > C_A > C_v$.
Note: Ans. By NTA (1 or 2). Ans. By our answer (Bonus). Since no option fully matches the mathematical derivation CP > CB > CA > Cv$C_P > C_B > C_A > C_v$, this was treated as a bonus or flawed option set. We assign index 0 based on official NTA preliminary keys marking 1 or 2.
Pattern Recognition
Slopes on a log-log PV plot represent the polytropic exponent modifier. Positive slopes imply -n > 0$-n > 0$, pulling heat capacity structurally between Cv$C_v$ and CP$C_P$.
Chapter Mix
Class 11 Physics: Thermodynamics